
Remember me


There’s a global rush for new sources of lithium to power the green-energy transition, including a major push for mining the critical metal in the U.S. Columbia Journalism Investigations and Inside Climate News teamed up to track this development trend. Here’s how we collected and analyzed data on new lithium projects—and examined which communities may be most affected by them.
The Data We UsedWe built a global dataset of lithium mining projects, including those in operating, planned and early stages, as well as the locations and the companies involved.
The dataset was primarily based on information culled from the financial firm S&P Global, which we cross-checked with government databases and company reports, filings, investor presentations and responses to questionnaires we sent to companies. We also used proprietary data from other providers, such as GlobalData. While we compiled most of the data manually, some fields were generated through automated document and web scraping and then verified.
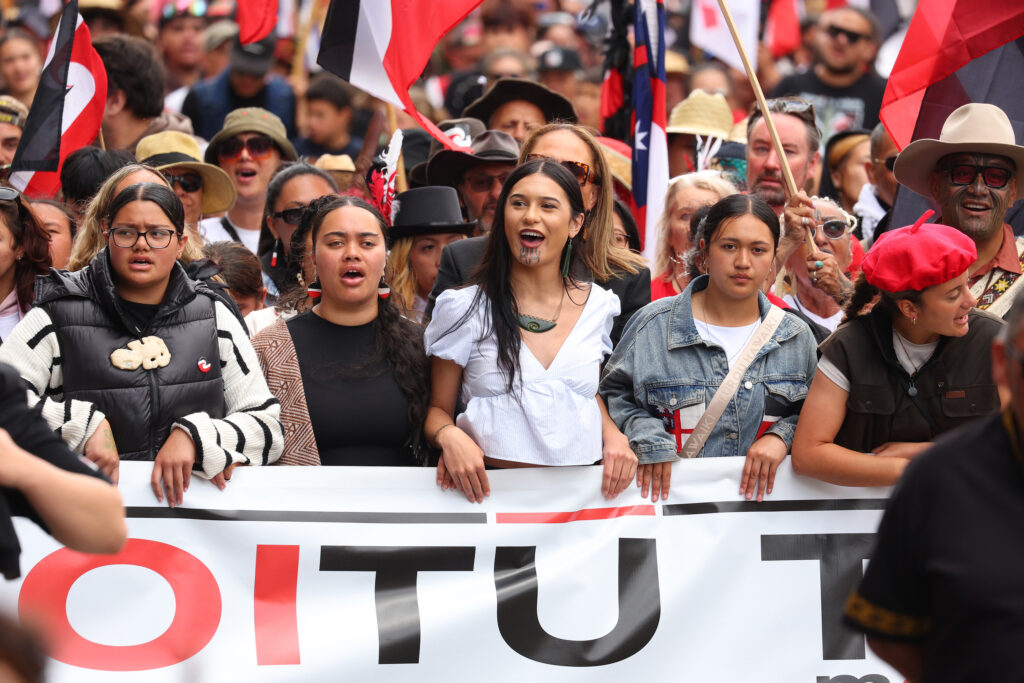
 How the Rush to Mine the Metal of the Future Echoes America’s Colonial Past
By Johanna Hansel, Carla Samon Ros, Wyatt Myskow
How the Rush to Mine the Metal of the Future Echoes America’s Colonial Past
By Johanna Hansel, Carla Samon Ros, Wyatt Myskow
We used additional S&P data to identify the shareholders of all companies involved in lithium mines. We manually downloaded company reports and used automated PDF scraping to build a second dataset that shows the largest shareholders, up to 25 per company. Some companies list fewer; others list more and often include small individual stakeholders—limiting the dataset to 25 each kept it manageable. For companies identified as subsidiaries of large public corporations, we compiled a separate dataset of parent company shareholders.
We also used the U.S. Social Vulnerability Index, developed by the Centers for Disease Control and Prevention (CDC). It uses U.S. Census data to estimate how vulnerable communities are to environmental and public health harms, based on demographic factors such as income, education, age, race, language, housing and access to transportation. Counties with higher scores are considered more likely to be adversely affected by disasters, air and water pollution, human health risks or climate hazards.
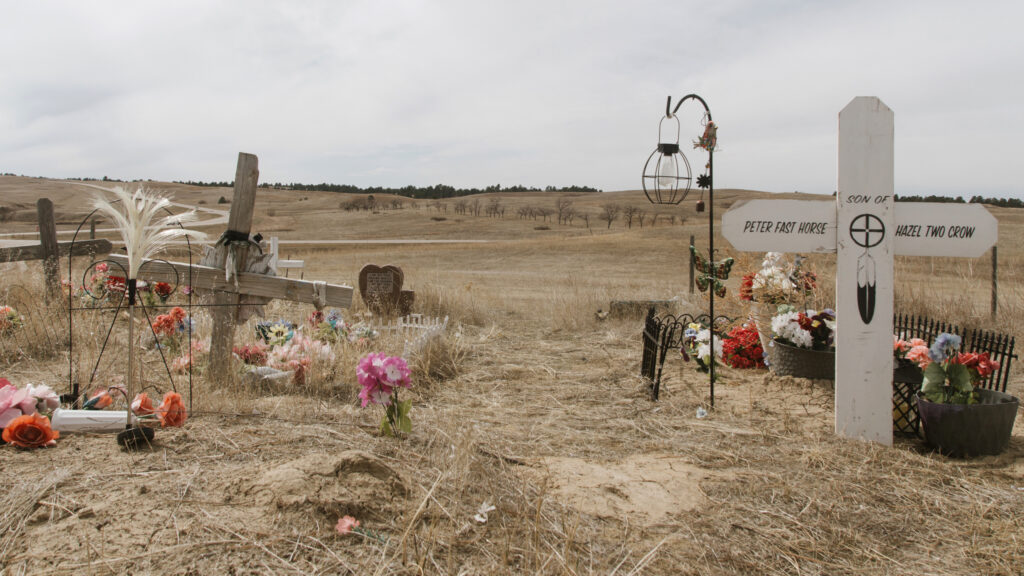
To analyze impacts on Indigenous communities, we used a global dataset of Indigenous lands compiled by Australian researchers led by Stephen T. Garnett and published in Nature Sustainability in 2018. The data maps lands used or claimed by Indigenous peoples worldwide. It is widely regarded as the most comprehensive global map of Indigenous territories. We supplemented this data with more detailed national data when available—for example, federal data on tribal reservations in the U.S.
How We Used the DataWe built a mapping tool combining the coordinates of active and proposed lithium mining projects with the Indigenous lands data. We then added data from Protected Planet, the most comprehensive global database of national parks, conservation zones and other protected areas.
After consulting experts, we drew a 10-kilometer radius around each project’s coordinates to approximate a potential zone of environmental impact. This accounts for any inaccuracies in reported locations and the fact that mines cover larger areas than a single coordinate. We used this tool to identify where mines overlap with Indigenous territories and protected areas and to flag specific projects for deeper reporting. Both the tool and the datasets are published here to make it possible for others to do their own research.
For our stories focused on America’s lithium rush, we created a subset of our lithium project dataset that only includes locations in the U.S., linking each project to county and state using those geographic coordinates. We matched projects to county-level data from the CDC’s Social Vulnerability Index (SVI). We assigned each project the surrounding county’s SVI score and grouped projects into four categories, ranging from low to very high vulnerability, according to the CDC’s methodology. This allowed us to analyze whether projects are concentrated in vulnerable communities and to identify geographic patterns.
We also analyzed how closely U.S. lithium projects are sited near tribal lands. For each project, we calculated the distance to the nearest reservation boundary and grouped projects into distance ranges (within 10, 15 or 20 miles). We then assessed how many projects fall within each range and mapped geographic patterns across states.
To test whether projects are located near multiple Indigenous territories, we examined all reservations within those distance ranges. This showed that most lithium projects sit near at most one Indigenous land area. Only two projects are within 20 miles of more than one. Overlapping proximity is therefore rare and concentrated in a few cases in Nevada, and was not a focus of our analysis.
To estimate future lithium production, we identified projects most likely to begin operating by 2030, based on projected timelines in our dataset and company disclosures. For these projects, we compiled expected production volumes and estimated how U.S. lithium output could grow relative to global supply. We derived global benchmarks from a range of industry forecasts, as well as analyses by the Federal Reserve Bank of Dallas, the World Economic Forum, the International Energy Agency and others.
Finally, we used company and shareholder data to analyze who is driving the lithium sector in the U.S. and around the world. We examined where companies are based, which countries host the most projects and who the largest known investors are. To assess influence, we standardized the shareholder names, grouped related entities and identified how often investors appear across different companies—a measure of their presence across the sector. We then analyzed the investors’ locations as compared to where lithium projects are sited. While many lithium mining companies are based in Canada and Australia, U.S.-based traditional investment managers play the largest role in financing them, our analysis shows.
To test our shareholder results, we also examined the size of investors’ disclosed stakes and their ranking in companies. The results remain consistent when restricting the analysis to the top 10 or five shareholders per company, and when weighting investors by rank. Across all specifications, the same group of large asset managers—including Vanguard, BlackRock, State Street, UBS and Dimensional—remains dominant.
We’ve made our data analysis available through GitHub.
Data LimitationsThe lithium sector is changing rapidly. Nearly every day a new mining project is announced, delayed or abandoned. Companies change ownership. And investors frequently buy and sell stakes. Our analysis is a snapshot in time based on the data available when we collected it. While we used S&P Global’s Capital IQ Pro—which is widely considered the most comprehensive and up-to-date commercial database for this type of information—even this data may lag behind real-world developments.
Not all data was complete or usable. Some projects could not be linked to identifiable companies, and some company or shareholder records were incomplete or inconsistent. In addition, many of the dataset’s shareholders do not have country-of-origin information. We cleaned the data by excluding unusable entries, so the analysis reflects the best available information, but not the full universe of projects or investors.
This story is funded by readers like you.Our nonprofit newsroom provides award-winning climate coverage free of charge and advertising. We rely on donations from readers like you to keep going. Please donate now to support our work.
Locations of lithium mining projects are approximate. In some cases, coordinates are provided as estimates by S&P or were inferred from company disclosures. Even when listed as exact, their precision cannot be guaranteed. We accounted for this by analyzing distances within ranges, which helps reduce the impact of location errors. We used point locations and did not model the full footprint of mining operations. Many projects are in early stages, and even for operating projects, real-world impacts are difficult to measure. We consulted with experts, who suggested that a 10-kilometer radius is a reasonable approximation of potential impact zones. This does not represent the actual scale or extent of environmental or social impacts. Proximity alone does not imply impact.
For proximity to tribal reservations, additional distance ranges were also considered. Our analysis measures the distance from each project to the nearest reservation boundary. Projects that may be close to multiple Indigenous territories are counted once. We tested whether this approach omits a meaningful part of the picture and found that it does not.
The CDC’s Social Vulnerability Index does not measure environmental exposure directly, but rather conditions that may make communities more vulnerable to it. The index is measured at the county level, meaning it reflects broader regional conditions than the specific communities or locations where mining projects operate.
The shareholder analysis is based on disclosed major investors, not complete ownership. S&P provides information on the largest known shareholders, but not all investors, and the total disclosed ownership often represents only part of a company’s shares. As explained above, we limited the analysis to the top 25 shareholders per company. In practice, this does not appear to lead to major truncation of top holders, as most companies listed in the dataset have fewer disclosed shareholders. The analysis focuses on the largest visible investors—those with the biggest disclosed stakes or consistently high rankings across companies. It identifies patterns of financial presence, but does not measure full ownership or control of individual companies. Investor location reflects where financial institutions are headquartered, not necessarily where the capital they invest ultimately comes from.
About This StoryPerhaps you noticed: This story, like all the news we publish, is free to read. That’s because Inside Climate News is a 501c3 nonprofit organization. We do not charge a subscription fee, lock our news behind a paywall, or clutter our website with ads. We make our news on climate and the environment freely available to you and anyone who wants it.
That’s not all. We also share our news for free with scores of other media organizations around the country. Many of them can’t afford to do environmental journalism of their own. We’ve built bureaus from coast to coast to report local stories, collaborate with local newsrooms and co-publish articles so that this vital work is shared as widely as possible.
Two of us launched ICN in 2007. Six years later we earned a Pulitzer Prize for National Reporting, and now we run the oldest and largest dedicated climate newsroom in the nation. We tell the story in all its complexity. We hold polluters accountable. We expose environmental injustice. We debunk misinformation. We scrutinize solutions and inspire action.
Donations from readers like you fund every aspect of what we do. If you don’t already, will you support our ongoing work, our reporting on the biggest crisis facing our planet, and help us reach even more readers in more places?
Please take a moment to make a tax-deductible donation. Every one of them makes a difference.
Thank you,