
Remember me


Very recently, my computer felt like it was fighting against me. Programs and processes that had worked fine suddenly started to drag. But the real frustration was that there wasn't a clear reason. Even the Task Manager showed normal activity when I looked at CPU and RAM usage.
When I finally figured it out, I was surprised that it wasn't any of the usual Windows culprits. This was a case of thermal throttling, where my hardware would automatically limit performance as the temperature rose. HWiNFO was the tool that revealed the pattern. It has become an essential part of my troubleshooting kit.
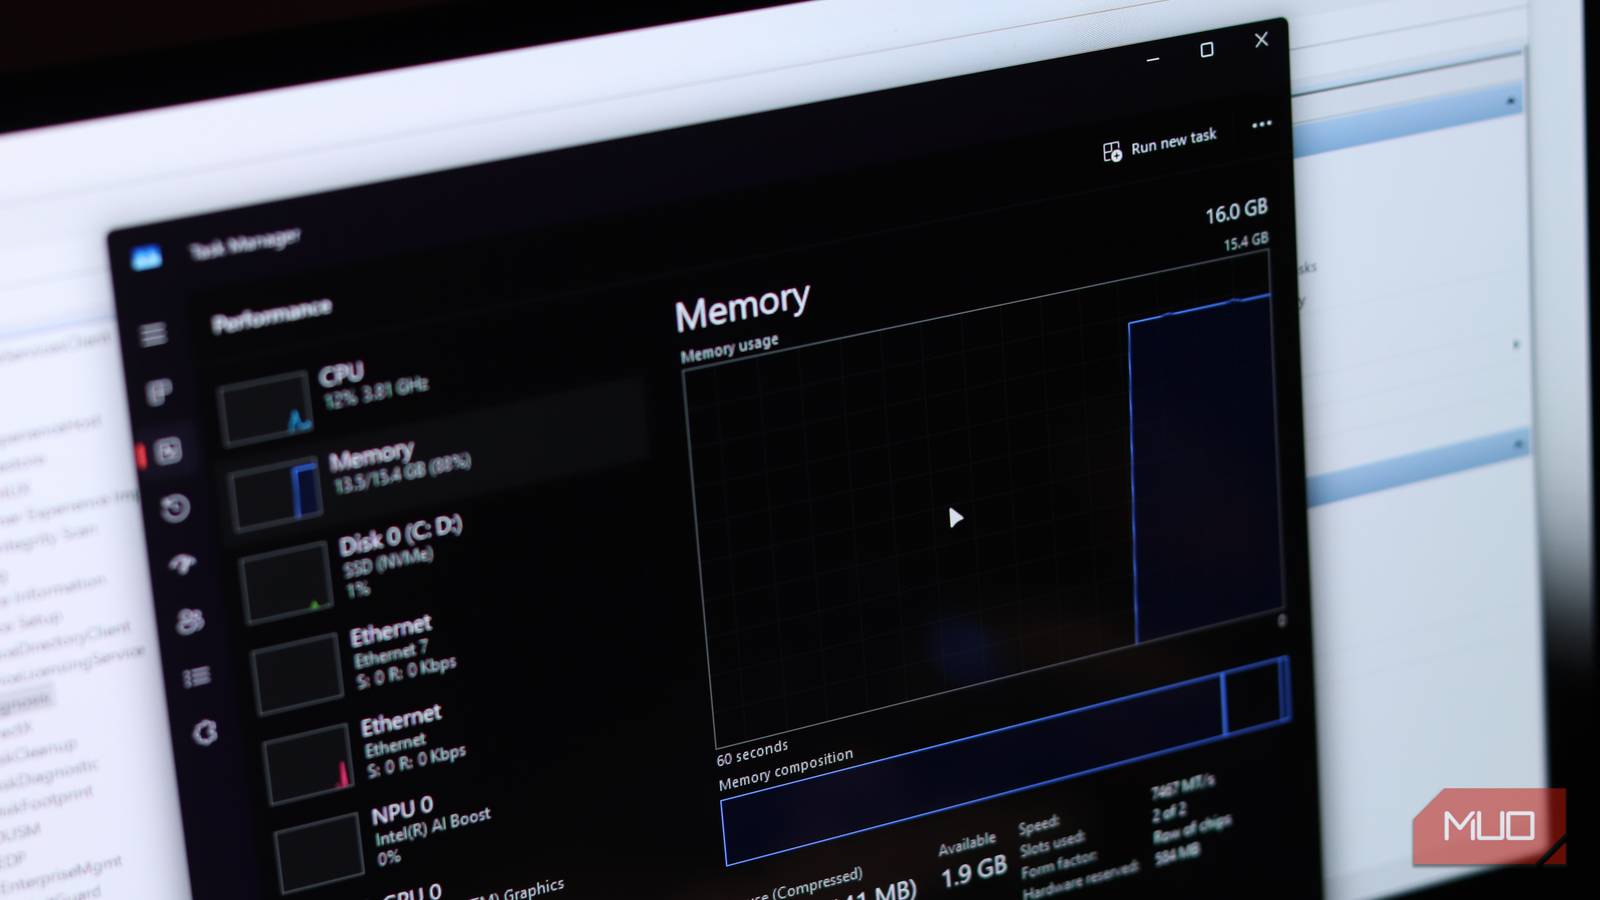
The slowdown didn't show up anywhere Why Windows tools completely miss what's actually happeningI've used Windows for decades, and it's second nature to open Task Manager when the system feels slow. It presents clear graphs for CPU, memory, Wi-Fi, and GPU.
So it was where I went when I noticed performance dips in games and lag with some of the programs I run daily. Task Manager, however, was showing normal fluctuations in GPU and CPU usage. I couldn't find runaway processes, nor was there any metric pinned at 100%.
Task Manager wasn't the problem. It was doing exactly what it was meant to do: showing you how busy the system is. It's not designed to show if apps or processes are performing at their expected speed. However, one of its biggest limitations is that it has no CPU temperature reading.
At the time, it hadn't occurred to me that the system could artificially hold back the CPU or GPU. But this is a default behavior with several modern processors. As soon as the temperature exceeds a certain threshold, the CPU/GPU lowers its clock speed as a defense against thermal damage. The OS sees it as normal operation, and it doesn't trigger any warnings or flags because it happens at the hardware level. That's why thermal throttling is tricky to catch, especially if you depend on built-in Windows tools. You may be experiencing a real performance crisis while the system says everything is fine.
 Related
The moment the slowdown finally made sense
Watching the throttle trigger live changed how I read the whole problem
Related
The moment the slowdown finally made sense
Watching the throttle trigger live changed how I read the whole problem
While gaming, I ran HWiNFO in Sensors-only mode to get live data streams. I allowed it to run for a bit while I continued gaming. It only took a few minutes for the Thermal Throttling indicator to turn red.
It was at this point that the problem started to make sense. The more I played, the more I could see the pattern repeat. The temperature reached the upper limit for my CPU, and the tool also registered sharp drops in core clock speeds. This was the pattern that activated the throttling flag each time. The longer I tested, the more it became clear that this pattern matched in-game dips. HWiNFO brought clarity:
Situation
Before HWiNFO
After HWiNFO
FPS drops
Felt random, no clear cause
Directly tied to temperature spikes
Export times
Inconsistent, hard to predict
Predictable (worse under sustained load)
Diagnosis
Guesswork
Confirmed thermal throttling
I had just confirmed that my system was forcing itself to slow down to remain within safe limits.
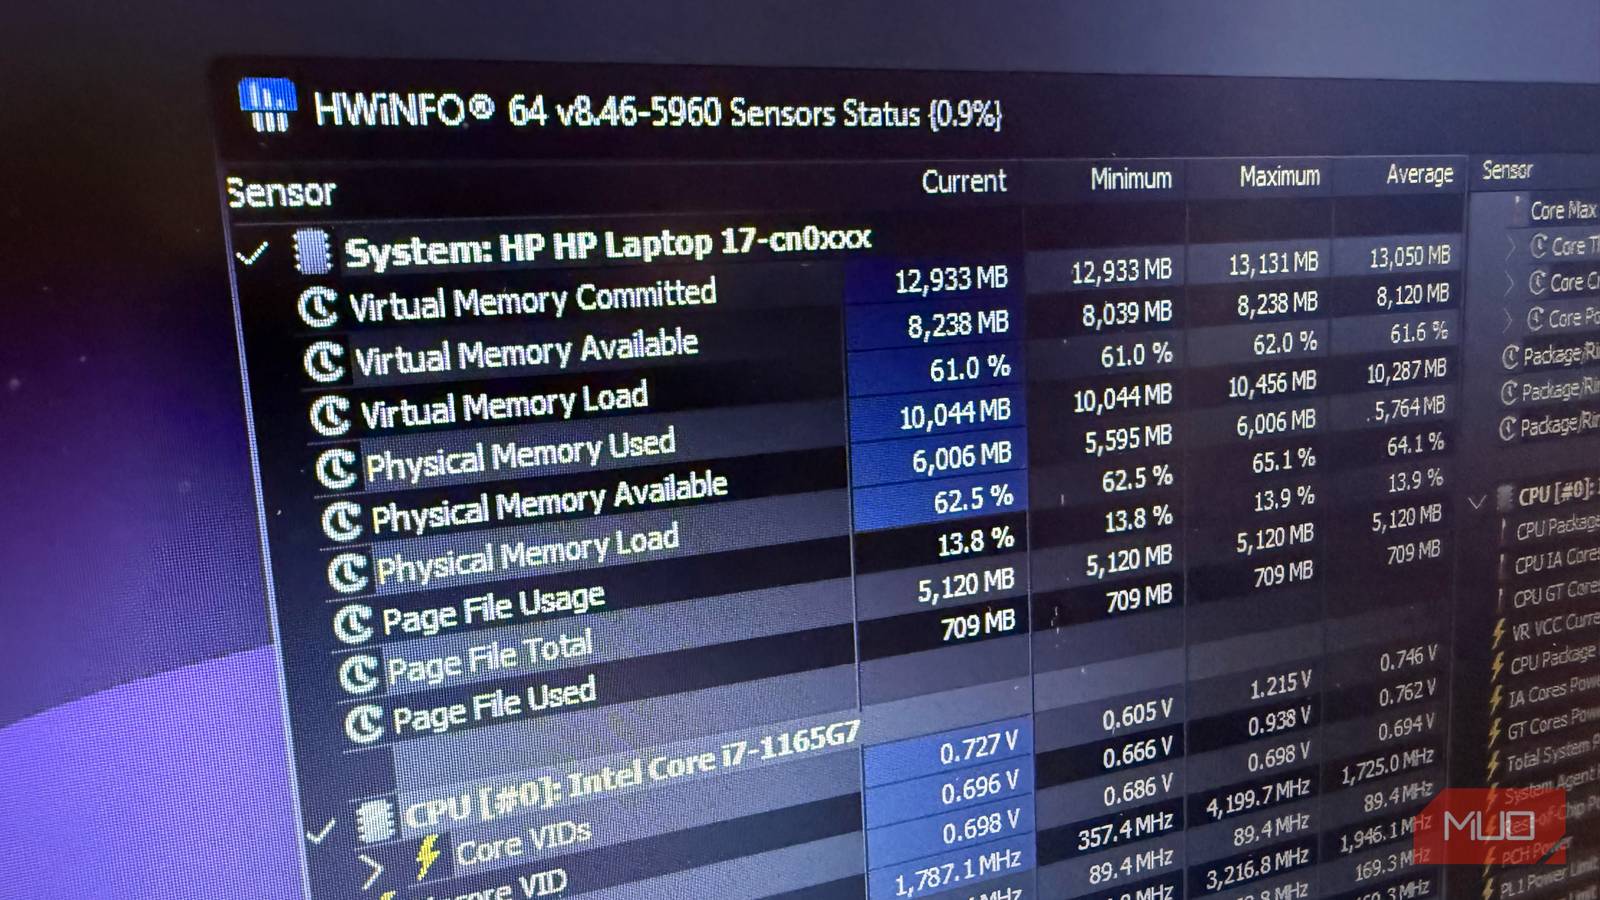
What HWiNFO shows that Task Manager never will Afam Onyimadu / MUO
HWiNFO is free and even offers a portable version that requires no installation. Sensors-only mode is the most useful for detecting thermal throttling. It doesn't scan every hardware component and has minimal resource impact, which is important when the system is running hot.
The CPU section is where the interesting details lie, specifically these two terms:
Thermal Throttling: This indicates the CPU has exceeded its safe operating temperature. Power Limit Throttling: This shows the CPU has reached its configured power ceiling (quite common on laptops with a strict TDP limit).Readings for both remain inactive under normal load, but they can instantly change to red once the limit is reached. What makes HWiNFO more valuable is that it lets you view throttling alongside other metrics that explain it.
For GPU monitoring, the GPU hotspot value is more reliable than the standard GPU temperature reading because it reflects the single hottest point on the GPU die, giving you a truer picture of whether the GPU is actually under thermal stress.
Here are a few flags I like to look out for:
Metric
What to watch for
Why it matters
CPU temperature
Sustained readings above ~90°C on Intel, ~95°C on AMD Ryzen
Indicates proximity to throttle threshold
Core clock speed
Drops during active load
Direct measure of lost performance
Thermal throttling flag
Red/active state
Confirms the CPU has hit its temperature limit
GPU hotspot
Peaks above 90°C
Reveals thermal stress the average GPU temp can mask
You can copy HWiNFO results or export them as a CSV file to review and identify exact moments when throttling occurs.
Removing the limiter is a different problem from boosting performanceWith my findings, the goal this time wasn't to make the computer faster, but just to stop it from slowing down. The fixes I implemented have varying impacts:
Fix
Effort
Typical impact
Dust cleaning
Low
High (often the single biggest improvement)
Airflow improvements
Low
Medium (depends on case or surface conditions)
Undervolting
Medium
High if stable, requires per-system testing
Thermal paste replacement
Medium
High on systems 3+ years old
After making these changes, temperatures were much lower during the same HWiNFO tests, and throttling flags were rarely triggered.