
Remember me


In this article, you will learn how to use a pre-trained large language model to extract structured features from text and combine them with numeric columns to train a supervised classifier.
Topics we will cover include:
Creating a toy dataset with mixed text and numeric fields for classification Using a Groq-hosted LLaMA model to extract JSON features from ticket text with a Pydantic schema Training and evaluating a scikit-learn classifier on the engineered tabular datasetLet’s not waste any more time.

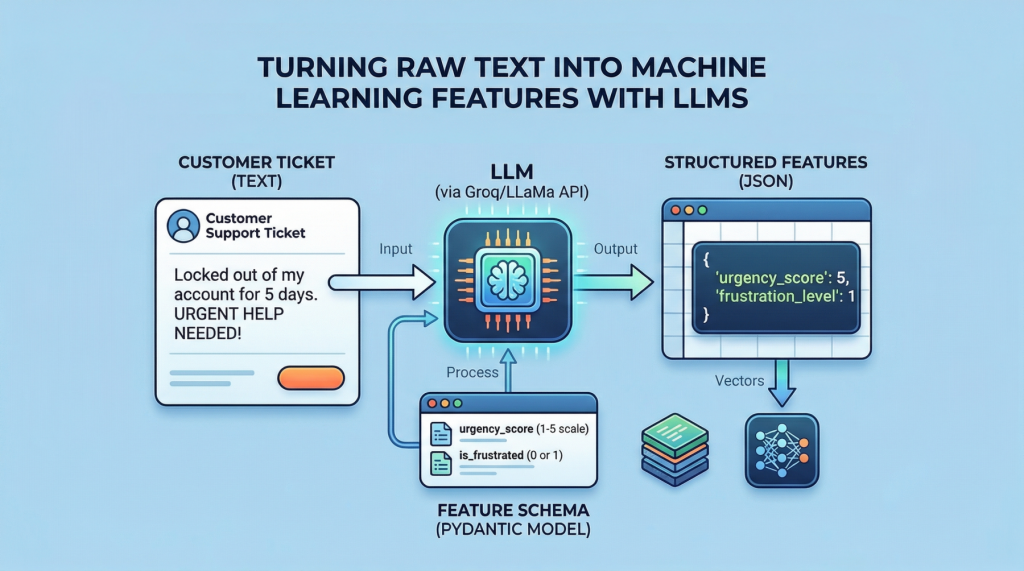
From Text to Tables: Feature Engineering with LLMs for Tabular Data
Image by Editor
While large language models (LLMs) are typically used for conversational purposes in use cases that revolve around natural language interactions, they can also assist with tasks like feature engineering on complex datasets. Specifically, you can leverage pre-trained LLMs from providers like Groq (for example, models from the Llama family) to undertake data transformation and preprocessing tasks, including turning unstructured data like text into fully structured, tabular data that can be used to fuel predictive machine learning models.
In this article, I will guide you through the full process of applying feature engineering to structured text, turning it into tabular data suitable for a machine learning model — namely, a classifier trained on features created from text by using an LLM.
Setup and ImportsFirst, we will make all the necessary imports for this practical example:
import pandas as pd import json from pydantic import BaseModel, Field from openai import OpenAI from google.colab import userdata from sklearn.ensemble import RandomForestClassifier from sklearn.model_selection import train_test_split from sklearn.metrics import classification_report from sklearn.preprocessing import StandardScaler
import pandas as pd
import json
from pydantic import BaseModel, Field
from openai import OpenAI
from google.colab import userdata
from sklearn.ensemble import RandomForestClassifier
from sklearn.model_selection import train_test_split
from sklearn.metrics import classification_report
from sklearn.preprocessing import StandardScaler
Note that besides common libraries for machine learning and data preprocessing like scikit-learn, we import the OpenAI class — not because we will directly use an OpenAI model, but because many LLM APIs (including Groq’s) have adopted the same interface style and specifications as OpenAI. This class therefore helps you interact with a variety of providers and access a wide range of LLMs through a single client, including Llama models via Groq, as we will see shortly.
Next, we set up a Groq client to enable access to a pre-trained LLM that we can call via API for inference during execution:
groq_api_key = userdata.get('GROQ_API_KEY') client = OpenAI( base_url="https://api.groq.com/openai/v1", api_key=groq_api_key )
groq_api_key = userdata.get('GROQ_API_KEY')
client = OpenAI(
base_url="https://api.groq.com/openai/v1",
api_key=groq_api_key
)
Important note: for the above code to work, you need to define an API secret key for Groq. In Google Colab, you can do this through the “Secrets” icon on the left-hand side bar (this icon looks like a key). Here, give your key the name 'GROQ_API_KEY', then register on the Groq website to get an actual key, and paste it into the value field.
Creating a Toy Ticket DatasetThe next step generates a synthetic, partly random toy dataset for illustrative purposes. If you have your own text dataset, feel free to adapt the code accordingly and use your own.
import random import time random.seed(42) categories = ["access", "inquiry", "software", "billing", "hardware"] templates = days and need urgent help!", "I can't log in, it keeps saying bad password.", "Reset my access credentials immediately.", "My 2FA isn't working, please help me get into my account." ], "inquiry": [ "When will my new credit card arrive in the mail?", "Just checking on the status of my recent order.", "What are your business hours on weekends?", "Can I upgrade my current plan to the premium tier?" ], "software": [ "The app keeps crashing every time I try to view my transaction history.", "Software bug: the submit button is greyed out.", "Pages are loading incredibly slowly since the last update.", "I'm getting a 500 Internal Server Error on the dashboard." ], "billing": [ "I need a refund for the extra charges on my bill.", "Why was I billed twice this month?", "Please update my payment method, the old card expired.", "I didn't authorize this $49.99 transaction." ], "hardware": [ "My hardware token is broken, I can't log in.", "The screen on my physical device is cracked.", "The card reader isn't scanning properly anymore.", "Battery drains in 10 minutes, I need a replacement unit." ] } data = [] for _ in range(100): cat = random.choice(categories) # Injecting a random number of days into specific templates to foster variety text = random.choice(templates[cat]).format(days=random.randint(1, 14)) data.append() df = pd.DataFrame(data)
1
2
3
4
5
6
7
8
9
10
11
12
13
14
15
16
17
18
19
20
21
22
23
24
25
26
27
28
29
30
31
32
33
34
35
36
37
38
39
40
41
42
43
44
45
46
47
48
49
50
51
52
53
import random
import time
random.seed(42)
categories = ["access", "inquiry", "software", "billing", "hardware"]
templates = days and need urgent help!",
"I can't log in, it keeps saying bad password.",
"Reset my access credentials immediately.",
"My 2FA isn't working, please help me get into my account."
],
"inquiry": [
"When will my new credit card arrive in the mail?",
"Just checking on the status of my recent order.",
"What are your business hours on weekends?",
"Can I upgrade my current plan to the premium tier?"
],
"software": [
"The app keeps crashing every time I try to view my transaction history.",
"Software bug: the submit button is greyed out.",
"Pages are loading incredibly slowly since the last update.",
"I'm getting a 500 Internal Server Error on the dashboard."
],
"billing": [
"I need a refund for the extra charges on my bill.",
"Why was I billed twice this month?",
"Please update my payment method, the old card expired.",
"I didn't authorize this $49.99 transaction."
],
"hardware": [
"My hardware token is broken, I can't log in.",
"The screen on my physical device is cracked.",
"The card reader isn't scanning properly anymore.",
"Battery drains in 10 minutes, I need a replacement unit."
]
}
data = []
for _ in range(100):
cat = random.choice(categories)
# Injecting a random number of days into specific templates to foster variety
text = random.choice(templates[cat]).format(days=random.randint(1, 14))
data.append()
df = pd.DataFrame(data)
The dataset generated contains customer support tickets, combining text descriptions with structured numeric features like account age and number of prior tickets, as well as a class label spanning several ticket categories. These labels will later be used for training and evaluating a classification model at the end of the process.
Extracting LLM FeaturesNext, we define the desired tabular features we want to extract from the text. The choice of features is domain-dependent and fully customizable, but you will use the LLM later on to extract these fields in a consistent, structured format:
class TicketFeatures(BaseModel): urgency_score: int = Field(description="Urgency of the ticket on a scale of 1 to 5") is_frustrated: int = Field(description="1 if the user expresses frustration, 0 otherwise")
class TicketFeatures(BaseModel):
urgency_score: int = Field(description="Urgency of the ticket on a scale of 1 to 5")
is_frustrated: int = Field(description="1 if the user expresses frustration, 0 otherwise")
For example, urgency and frustration often correlate with specific ticket types (e.g. access lockouts and outages tend to be more urgent and emotionally charged than general inquiries), so these signals can help a downstream classifier separate categories more effectively than raw text alone.
The next function is a key element of the process, as it encapsulates the LLM integration needed to transform a ticket’s text into a JSON object that matches our schema.
def extract_features(text: str) -> dict: # Sleep for 2.5 seconds for safer use under the constraints of the 30 RPM free-tier limit time.sleep(2.5) schema_instructions = json.dumps(TicketFeatures.model_json_schema()) response = client.chat.completions.create( model="llama-3.3-70b-versatile", messages=[ " }, ], response_format=, temperature=0.0 ) return json.loads(response.choices[0].message.content)
1
2
3
4
5
6
7
8
9
10
11
12
13
14
15
16
17
18
def extract_features(text: str) -> dict:
# Sleep for 2.5 seconds for safer use under the constraints of the 30 RPM free-tier limit
time.sleep(2.5)
schema_instructions = json.dumps(TicketFeatures.model_json_schema())
response = client.chat.completions.create(
model="llama-3.3-70b-versatile",
messages=[
"
},
],
response_format=,
temperature=0.0
)
return json.loads(response.choices[0].message.content)
Why does the function return JSON objects? First, JSON is a reliable way to ask an LLM to produce structured outputs. Second, JSON objects can be easily converted into Pandas Series objects, which can then be seamlessly merged with other columns of an existing DataFrame to become new ones. The following instructions do the trick and append the new features, stored in engineered_features, to the rest of the original dataset:
print("1. Extracting structured features from text using LLM...") engineered_features = df["text"].apply(extract_features) features_df = pd.DataFrame(engineered_features.tolist()) X_raw = pd.concat([df.drop(columns=["text", "label"]), features_df], axis=1) y = df["label"] print("\n2. Final Engineered Tabular Dataset:") print(X_raw)
print("1. Extracting structured features from text using LLM...")
engineered_features = df["text"].apply(extract_features)
features_df = pd.DataFrame(engineered_features.tolist())
X_raw = pd.concat([df.drop(columns=["text", "label"]), features_df], axis=1)
y = df["label"]
print("\n2. Final Engineered Tabular Dataset:")
print(X_raw)
Here is what the resulting tabular data looks like:
account_age_days prior_tickets urgency_score is_frustrated 0 564 0 5 1 1 1517 3 4 0 2 62 0 5 1 3 408 2 4 0 4 920 1 5 1 .. ... ... ... ... 95 91 2 4 1 96 884 0 4 1 97 1737 0 5 1 98 837 0 5 1 99 862 1 4 1 [100 rows x 4 columns]
account_age_days prior_tickets urgency_score is_frustrated
0 564 0 5 1
1 1517 3 4 0
2 62 0 5 1
3 408 2 4 0
4 920 1 5 1
.. ... ... ... ...
95 91 2 4 1
96 884 0 4 1
97 1737 0 5 1
98 837 0 5 1
99 862 1 4 1
[100 rows x 4 columns]
Practical note on cost and latency: Calling an LLM once per row can become slow and expensive on larger datasets. In production, you will usually want to (1) batch requests (process many tickets per call, if your provider and prompt design allow it), (2) cache results keyed by a stable identifier (or a hash of the ticket text) so re-runs do not re-bill the same examples, and (3) implement retries with backoff to handle transient rate limits and network errors. These three practices typically make the pipeline faster, cheaper, and far more reliable.
Training and Evaluating the ModelFinally, here comes the machine learning pipeline, where the updated, fully tabular dataset is scaled, split into training and test subsets, and used to train and evaluate a random forest classifier.
print("\n3. Scaling and Training Random Forest...") scaler = StandardScaler() X_scaled = scaler.fit_transform(X_raw) # Split the data into training and test X_train, X_test, y_train, y_test = train_test_split(X_scaled, y, test_size=0.4, random_state=42) # Train a random forest classification model clf = RandomForestClassifier(random_state=42) clf.fit(X_train, y_train) # Predict and Evaluate y_pred = clf.predict(X_test) print("\n4. Classification Report:") print(classification_report(y_test, y_pred, zero_division=0))
print("\n3. Scaling and Training Random Forest...")
scaler = StandardScaler()
X_scaled = scaler.fit_transform(X_raw)
# Split the data into training and test
X_train, X_test, y_train, y_test = train_test_split(X_scaled, y, test_size=0.4, random_state=42)
# Train a random forest classification model
clf = RandomForestClassifier(random_state=42)
clf.fit(X_train, y_train)
# Predict and Evaluate
y_pred = clf.predict(X_test)
print("\n4. Classification Report:")
print(classification_report(y_test, y_pred, zero_division=0))
Here are the classifier results:
Classification Report: precision recall f1-score support access 0.22 0.18 0.20 11 billing 0.29 0.33 0.31 6 hardware 0.29 0.25 0.27 8 inquiry 1.00 1.00 1.00 8 software 0.44 0.57 0.50 7 accuracy 0.45 40 macro avg 0.45 0.47 0.45 40 weighted avg 0.44 0.45 0.44 40
Classification Report:
precision recall f1-score support
access 0.22 0.18 0.20 11
billing 0.29 0.33 0.31 6
hardware 0.29 0.25 0.27 8
inquiry 1.00 1.00 1.00 8
software 0.44 0.57 0.50 7
accuracy 0.45 40
macro avg 0.45 0.47 0.45 40
weighted avg 0.44 0.45 0.44 40
If you used the code for generating a synthetic toy dataset, you may get a rather disappointing classifier result in terms of accuracy, precision, recall, and so on. This is normal: for the sake of efficiency and simplicity, we used a small, partly random set of 100 instances — which is typically too small (and arguably too random) to perform well. The key here is the process of turning raw text into meaningful features through the use of a pre-trained LLM via API, which should work reliably.
SummaryThis article takes a gentle tour through the process of turning raw text into fully tabular features for downstream machine learning modeling. The key trick shown along the way is using a pre-trained LLM to perform inference and return structured outputs via effective prompting.
Comments (0)