
Remember me
Summary: A four-step framework for building influence over product direction by closing the information gaps that large, complex organizations create.
Let me tell you a story I recently heard. A lead designer at an online review platform kept hearing that businesses were cancelling their ads because the setup was too confusing. The setup experience was slightly different on mobile, desktop, and web. The problem was split across the three teams, none of whom had the whole picture. Sound familiar?
The lead designer pieced together a comprehensive view of the problem by pulling together support tickets, past research, roadmaps, and analytics from all three teams. She then proposed three solutions that accounted for each team’s constraints. When her senior stakeholders saw the rigor behind her solutions, they asked for her recommendation. She saw the problem, took the initiative to gather the information she needed, and synthesized it into a recommendation that boosted her influence over what got built. This is design autonomy.
What Is Design Autonomy?Design autonomy refers to designers’ ability to make informed decisions about product direction, not only surface-level UI choices.
When designers have high degrees of autonomy, their recommendations inform feature ideas, feature prioritization, and roadmap planning. With low degrees of autonomy, even skilled designers execute predefined solutions without the context or influence to provide strategic input.
In complex product organizations, decisions are rarely made unilaterally, which is a good thing. Autonomy isn’t about deciding alone. Our research shows that autonomy is about becoming sufficiently informed to credibly shape shared product decisions. In our study, the designers who achieved high autonomy did so by collecting and applying knowledge about user needs, organizational context, and technical context to their work.
Our Research: How We Studied Design AutonomyWe wanted to learn about the tactics that help designers make the shift from low autonomy to high autonomy. We interviewed 5 design practitioners who successfully made the shift within large organizations spanning industries such as finance, healthcare, manufacturing, architecture, and online reviews. The designers who gained the most autonomy were the ones who gathered and applied information by building an information pipeline.
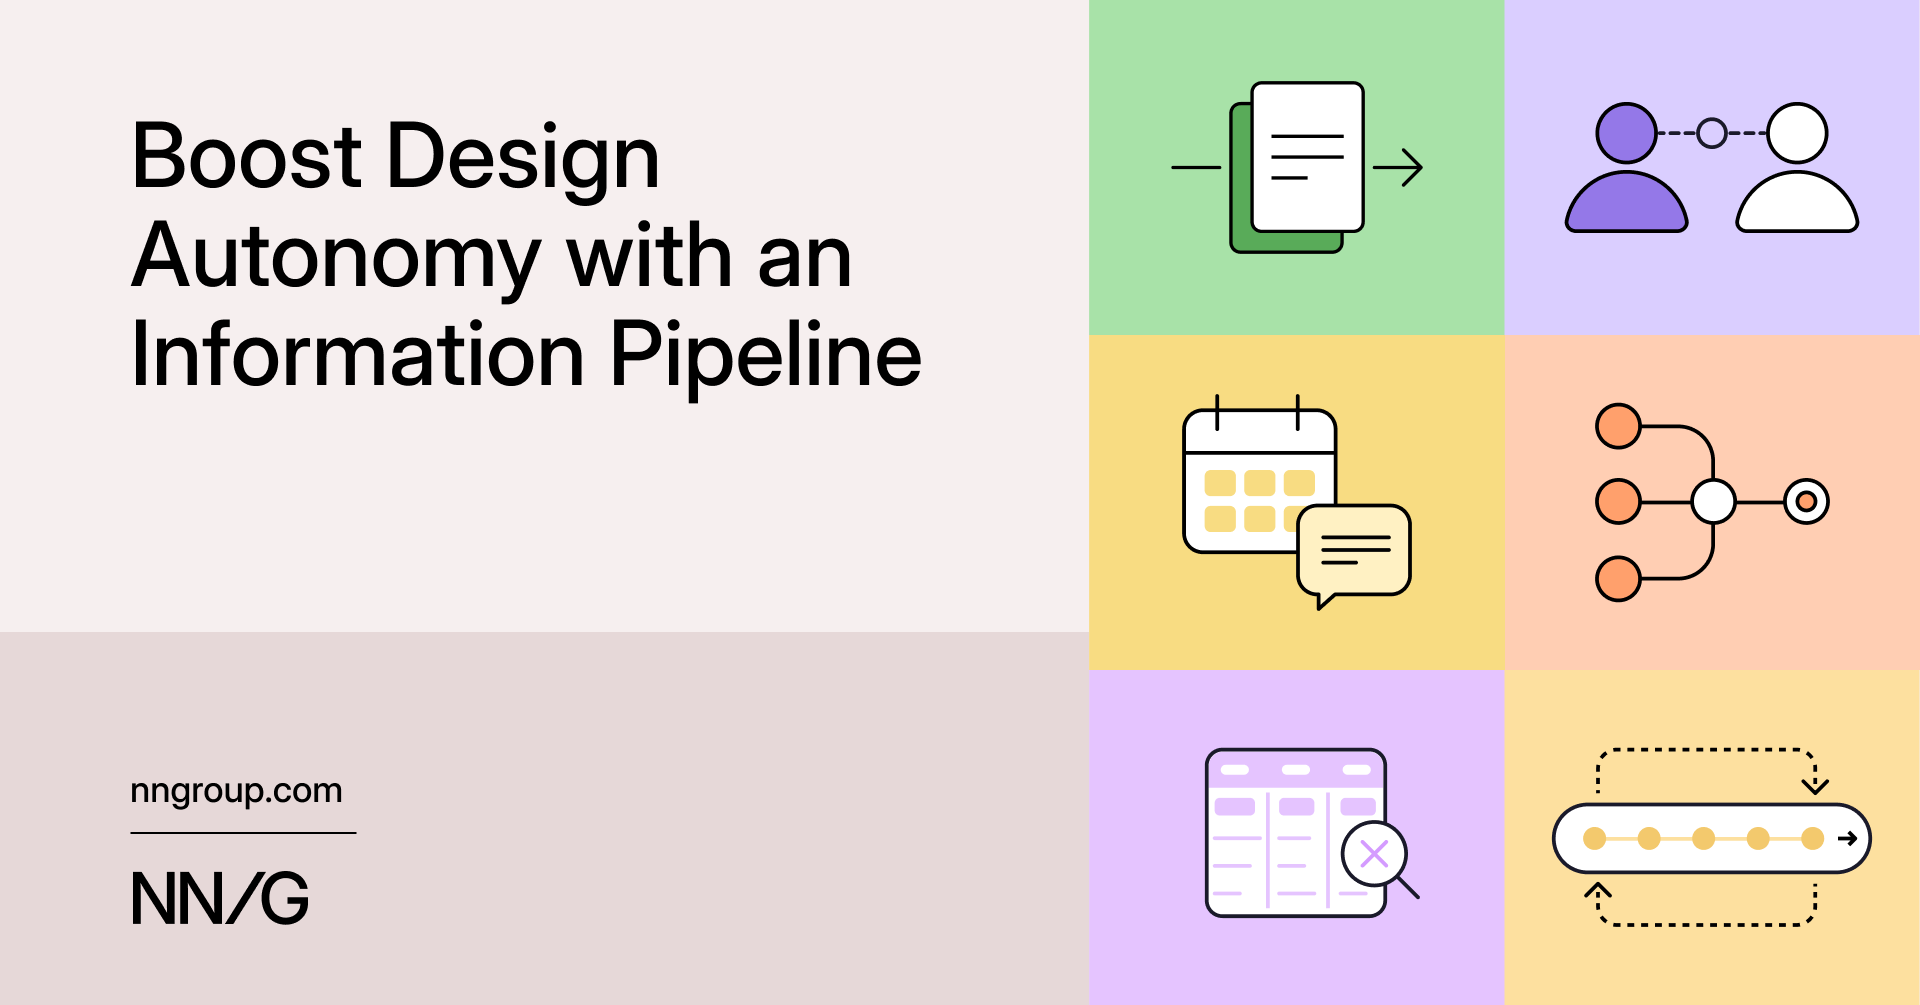
Building an Information PipelineDesigners who achieved high autonomy kept information flowing to them from all sources within their organization. Their pipelines consisted of four parts:
Gathering information from across teams and channels Building relationships with people who provide information Creating crossfunctional spaces for information to be shared (e.g., meetings, Slack channels) Synthesizing information to form a “big picture” of context that empowered credible recommendationsEach segment of the pipeline built on the previous one. The volume of information designers gathered often increased as they built their network of relationships. By inviting partners to join crossfunctional spaces to exchange information, they fostered alignment among teams. The information shared throughout all four stages empowered informed decision making about product direction.
1. Gather InformationAll designers described information gathering as a prerequisite to synthesis, which is when the pipeline delivers tangible value. They started by looking for information sources that showed what’s happening in the user experience, such as:
Crossteam analytics: What are users doing before and after the part of the user journey I design? Customer-support tickets and interactions: Where is the experience failing, in users' own words?Once designers understood what was happening in the experience, they found the following sources helpful in building a broader context:
Past user research from other teams: What have adjacent teams already learned that could explain what’s happening in the experience and inform design? Roadmaps from adjacent teams: How does their work connect to the problems and solutions other teams are pursuing? Communication archives: What’s the rationale behind decisions made informally in the past?One senior designer worked on a team dedicated to the onboarding phase of a financial product. She was curious about what happened to users after onboarding, so she reached out to the product-activation team for analytics and found that many users dropped off during the transition from onboarding to activation. She then requested relevant user research from the activation team’s designer and, through her synthesis, discovered that the onboarding process had set unrealistic expectations for the activation experience, leading to confusion and dropoff. By combining sources across teams, she identified a problem affecting both phases and proposed an informed fix.
How to Track InformationEach designer we interviewed aggregated their information in a central, quick-to-access location. The lead designer for an online review platform showed us her Google Docs dynamic information tracker containing six columns: projects, owners, product, file(s), status, and notes.
She updated the files, status, and notes whenever she found or learned new information, often after key meetings. For example, she updated projects with an in experiment status after she knew their outcome. Keeping the tracker current made it worthwhile and helped her spot cross-team connections, such as:
Projects that affected the same user journey: If other teams were redesigning user-journey steps that preceded or followed hers, she could incorporate those changes into her designs and flag conflicts early. Problems already solved by another team: She saved weeks by surfacing that another team had already tested a similar design, thus building her reputation as a knowledgeable and trustworthy collaborator. Deprioritized projects: She recorded reasons for deprioritizing work and the original rationale for pursuing it, preserving this information for future reference. 2. Build RelationshipsDesigners reported gaining the most valuable information from people outside of their team. The designers who gained the most autonomy not only built relationship capital but also spent it often, to gather information regularly.
Partner with Domain ExpertsIn specialized industries, designers often struggled with limited domain knowledge, which hindered their design autonomy. Building relationships with domain experts (internal or external to their organization) helped bridge these knowledge gaps, as experts could clarify technical concepts in practical terms.
For example, a designer building a flood-risk tool for construction planners had no prior experience with construction. She asked her product manager to connect her with a construction expert, who explained which weather data is valuable, what it means in plain terms, and how it is used in project planning. She checked in regularly with this expert, which meant her recommendations reflected real, technically complex workflow constraints. Designers don’t need to become subject-matter experts, but relationships with experts can fill critical knowledge gaps.
Map Your DependenciesDesigners maintained autonomy by monitoring upstream and downstream dependencies. Upstream dependencies supply inputs for your work, so their changes may disrupt your designs. Downstream dependencies rely on your output, so your changes could affect theirs.
A designer building a patient portal for medical-test results identified the electronic-health-record system as an upstream dependency because labs used it to enter blood-test results, which got displayed in the patient portal. He identified patient support as a downstream dependency because that team used information from the patient portal as input when handling patient calls. Hence, any changes to how results were displayed directly impacted its ability to support patients. By building relationships with both teams, he anticipated upstream and downstream effects on design, convincing partners to involve him more closely in product decisions.
Set Expectations Through a Design-Operations GuideSeveral designers still struggled with ad-hoc design requests arriving without context, which pulled them into reactive execution — the opposite of autonomy.
For instance, a senior designer’s product manager regularly asked her at the last minute to polish wireframes he’d created. In response, she made a design-operations guide to set expectations about what design delivers and what information it needs. Her guide mapped each type of design deliverable to its business impact, approximate time required to complete, and the inputs she needed from the requester. It educated her colleagues across teams and reduced last-minute requests for visual polish. Over time, it led to her colleagues involving her earlier in product development.
3. Create Crossfunctional SpacesSome designers found that they weren’t invited to certain meetings and channels, even when the decisions affected their work. In response, they created new spaces for information to flow between disciplines. These spaces ranged from recurring meetings to shared message channels.
For example, three designers in our study initiated recurring retrospectives with designers, product managers, and engineers. They started with one quarterly meeting with a small participant list. One designer invited only one product manager and engineer to test out the format, documenting the takeaways (e.g., requests for process changes, project updates, and questions about the design system) in a Miro board, to demonstrate the value of the retrospectives. As other PMs and engineers reviewed the outputs, they joined in, too. Over time, PMs began inviting these three designers to their own meetings, giving them access to even more information. The same designer made a small, powerful habit of starting retrospectives by having all attendees express appreciation. For example, she thanked a PM for flagging a constraint early enough for her to accommodate it in her design. Expressing appreciation motivated the PM to keep sharing information proactively.
4. Synthesize InformationDesigners saw the payoff of systematically tracking information from different sources when they synthesized it all. For example, the lead designer from our opening compiled roadmaps, analytics, past research, results from prior experiments, and support tickets from across three teams. Individual sources were ambiguous signals on their own, because a spike in a specific type of support issue, for example, could mean many things. However, when analytics, support tickets, and user research pointed to the same problem, these converging signals formed a “big picture” she could use to propose an appropriate solution.
Interviewees emphasized taking a “show, don’t tell” approach when communicating the “big picture” behind their recommendations. One designer used a simple tradeoff table (shown below) to compare solution options across multiple contextually relevant criteria. She distilled information from more than ten sources across teams into a single table.
The lead designer’s tradeoff table compared solutions across multiple criteria. Solution Option 1 Solution Option 2 Solution Option 3 User Impact Address 95% of complaints Address 80% of complaints Address 60% of complaints Business Impact Reduce cancellations from 23% to 15%; reduce support volume by ~35% Reduce cancellations from 23% to 20%; reduce support volume by ~20% Reduce cancellations from 23% to 21%; reduce support volume by ~10% Time to Launch 3 months 6 weeks 3 weeks Engineering Effort High (API integration, cross-platform development) Moderate Low (design updates, copy changes) Future maintenance Medium (ongoing as experience evolves) Medium Low (periodic design refreshes) Parity between devices Yes Improved Improved In summary… Transforms ad configuration into a trusted experience–solves root problem but higher investment needed Balanced approach that improves consistency significantly Easy fix that sets expectations more appropriately but doesn’t solve underlying trust issues Pipeline MaintenanceMaintenance is essential to keep a pipeline useful. Information needs to be regularly added and audited, and relationships need to be tended to stay warm. The time required will fluctuate, but routine maintenance is frequent and light, with heavier lifting required at the start of new initiatives.
Starting the PipelineDesigners often spent several hours gathering information at the start of projects — often before official meetings—by conducting internal desk research, reaching out to colleagues for relevant details, and searching for useful insights.
Regular AdditionsA successful lead designer spent about an hour weekly updating his tracker after each important crossfunctional meeting. . During these meetings, he consistently asked his partners followup questions about their work that yielded valuable new information.
Auditing and ArchivingA pipeline can become noisy if outdated information clouds the latest knowledge. To keep your tracker useful, periodically audit what you track by asking:
Does this information still affect decisions I need to make? Has this problem already been solved or deprioritized? Is this connected to any current or upcoming initiatives? Would I reference this in any upcoming recommendations?If your answer to most of these questions is no, move the item to an archive, rather than deleting it. Archiving reduces noise without losing information you might want later.
Reciprocal ExchangeTo ensure a steady supply of people willing to share information, designers prioritized relationship maintenance. One designer regularly shared relevant information with her crossfunctional partners, including research findings, alerts about upcoming design changes, and relevant articles, without expecting anything in return. It opened the door to natural conversations with product managers and engineers on other teams, so when she did ask for information, it felt like an exchange, rather than a one-sided transaction or audit.
ConclusionIn large, complex-product organizations, design autonomy realistically develops over months to years through consistently synthesizing and applying information to make highly trustworthy design recommendations. The designers we interviewed all described this journey as initially overwhelming, but navigable with time. One designer who moved from a 30-person startup into a large healthcare organization observed:
“There were no constraints [at the startup]. There are so many barriers now, but then, [three years in] you get really good at navigating it.”
The learning curve they described was an information curve. The designers who moved through it the fastest treated information as something to seek actively, rather than to wait for passively.
Start by asking yourself:
Where are your largest information gaps right now? Who outside your immediate team has information that affects your designs? Do you know what your upstream and downstream dependencies are? If you are excluded from meetings where decisions about your work are made, how might you get that information? Think of your last recommendation. Could you explain the information you synthesized and weighed?You don’t need to build the whole pipeline at once, and you can’t do it overnight. Start with one gap or one relationship and build from there.
Free DownloadsTo get you started, we’ve put together a package of templates to help you build your information pipeline:
Information Tracker Template Information-Gathering Outreach Scripts Dependency Map Template Design Operations Guide Template
Comments (0)